Any question
Ask in plain language, the way you would ask a colleague. No query language, no waiting on an analyst.
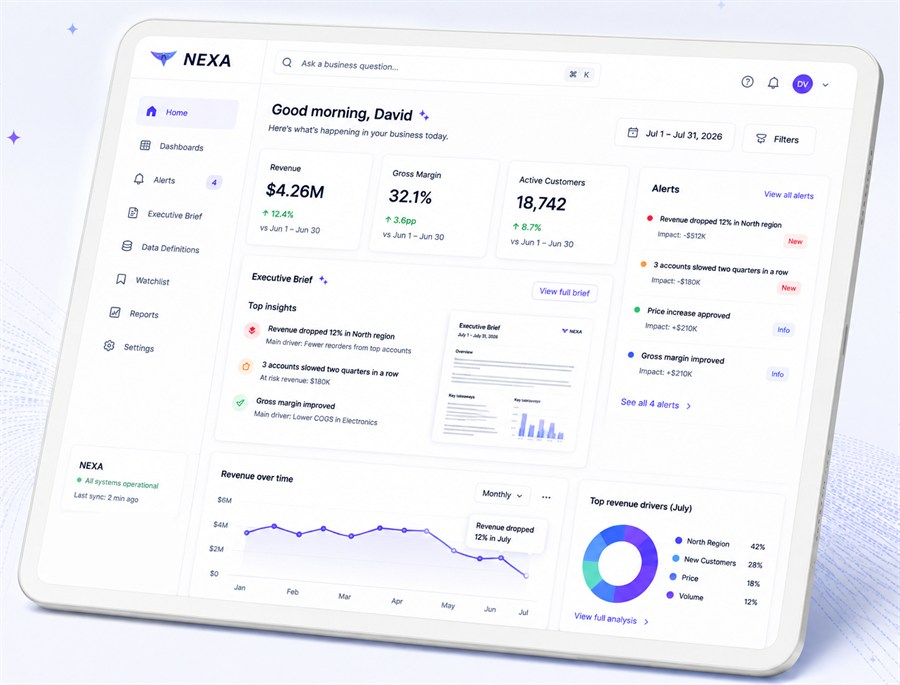
NEXA continuously analyzes your business, detects anomalies, forecasts performance, and delivers actionable insights — before you even ask.
Everything a manager needs between wondering about something and doing something about it.
Ask in plain language, the way you would ask a colleague. No query language, no waiting on an analyst.
Dashboards and reports created by describing what you want to see, then kept up to date for you.
NEXA watches the metrics that matter and notices when something moves — you don't have to check.
NEXA explains what changed, why it matters and what deserves attention — in business language, not just charts and numbers.
Alerts and executive briefs the moment something needs a decision — a risk worth containing or an opening worth taking.
Most companies don't have a clean data layer. That is our job, not yours.
NEXA answers questions, builds dashboards and monitors your business using governed business definitions — not AI-generated calculations.
Book a Live WalkthroughExample conversation with NEXA. Answers and charts, on demand.
See NEXA working on your own data before you commit to anything.
Your operational database, spreadsheets, and BI if you have it. Nothing to rebuild, nothing to move.
We start with the numbers your executives actually watch.
A working environment in days, not a months-long project.
Your existing systems keep running exactly as they do today.
Add more sources and domains once the value is proven.
Nothing new to buy. Comparable tools need a data warehouse, a data team and their platform underneath before anything works. NEXA reads the systems you already run — so a pilot starts this month, and the proof of concept is on us.
Book a DemoThey return a number that looks right and isn't. NEXA is designed to make wrong answers visible — not plausible.
Every figure comes from definitions you approved. When NEXA derives something — a change, a ratio, a share — it shows the approved figures it used, so you can check the arithmetic yourself. What it never does is decide what a number means or where it came from.
NEXA starts with a business layer designed for your domain, then adapts it to the definitions your company actually uses. Revenue, customers, margins and KPIs mean what your business says they mean.
Ask something the agreed definitions can't answer and NEXA says so, then tells you what it would need. No plausible guesses, no silent gaps — the behaviour that makes an analyst worth trusting.
Critical business questions are validated against results you have already approved, so you can see how NEXA performs on your own numbers before relying on it.
Why this matters: many failures in AI-generated data queries are semantic — the model guesses what a field means rather than failing on syntax. The fix isn't a smarter model. It's definitions the model isn't allowed to invent.
No migration project, no new data warehouse. NEXA works on the data you already have.
Read-only access to the systems you already run — operational database, spreadsheets, Power BI. Your data stays where it is.
Type a question the way you would ask a colleague. NEXA reads the live schema and your numbers.
Get the answer, the chart, and a clear next step you can act on the same day.
Tell us about your team and we will set up a live walkthrough of NEXA on your kind of data.
Prefer email? contact@nexabi.ai